
Crypto Starter
Start your crypto journey from absolute zero with approachable explanations and foundational concepts.

Crypto Trading — Risk Management Basics
risk percentage, stop loss, risk–reward, and position size. These simple foundations help you protect your capital, remove emotional mistakes, and choose trades with clarity instead of guessing. Mastering these basics makes every chart, signal, and decision easier to handle.

Crypto Trading — Signals & Confirmations
clear signs on the chart that show interest, momentum, and direction. Understanding how a signal forms, and how confirmation strengthens it, helps beginners read real behavior instead of reacting to random candles.

Crypto Trading — Basic Patterns
Trading patterns are simple visual clues that show how buyers and sellers behave on the chart. By learning the basics—like the Double Top, Double Bottom, and Flag—you understand where the market may reverse, where momentum continues, and how price reacts to key levels. These patterns don’t predict the future, but they remove guesswork and help beginners read structure instead of noise. With just a few core patterns, you can spot reversals, follow strong trends, and build confidence without advanced tools.

Crypto Trading — Chart Tools & Drawing Basics
Trendlines show direction, horizontal levels mark where price reacts, zones highlight strong demand or supply, and rays extend moves into the future. With these simple tools, the chart stops feeling random and starts showing you a clear map of the market.
Crypto Trading — Support & Resistance Basics
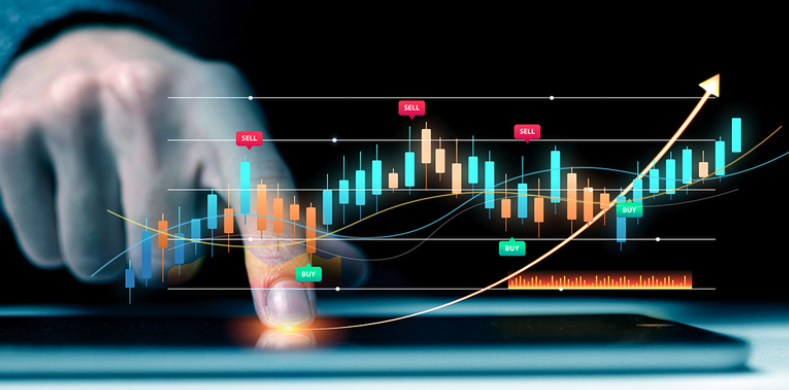
Support and resistance are the key price zones where the market repeatedly reacts. Support acts like a floor where buyers step in, and resistance works as a ceiling where sellers push back. By learning these levels, beginners stop guessing and start reading market behavior with clarity. These zones help you understand momentum shifts, improve entries and exits, and build confidence in every chart you analyze.

Crypto Trading — Market Trend Basics
A trend is the market’s direction — up, down, or sideways — and it’s the foundation of understanding price movement. Each trend forms through waves that show strength and weakness between buyers and sellers. When beginners learn to read these structures, trading becomes clearer, calmer, and far more logical. Instead of guessing what might happen, you learn to follow what the market is already showing you.

Crypto Trading — Chart Types: Line, Bar, Candlestick
Line charts give you a simple view of direction, bar charts add structure and range, and candlestick charts reveal both movement and emotion. Once you understand these three chart types, switching between them no longer feels confusing. You can choose the one that matches your style and see the same market with the level of detail that makes you feel most in control.
Crypto Trading — Chart Timeframes
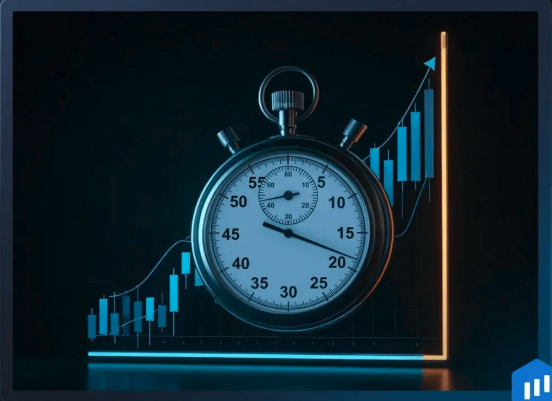
Timeframes change the way the same market looks: small ones show detail, big ones show direction. Choose a primary pace, confirm with a higher chart, and refine with a lower one. Read top-down—from Daily to your entry chart—so every decision serves the bigger trend, not the noise.

Crypto Trading — Candlestick Basics
Every candlestick tells a story — where price began, how far it moved, and who won the silent battle between buyers and sellers. Green candles show confidence, red ones reveal fear, and the wicks mark hesitation. Once you learn to read them, charts stop being random shapes and start becoming conversations between emotions and decisions. Understanding candles isn’t about prediction — it’s about learning to see the market clearly, one candle at a time.

Crypto Trading — Trading Chart Basics
When you first look at a trading chart, it might seem confusing — full of lines, colors, and moving numbers. But don’t worry. A chart is simply a picture of price over time. Every trader in the world — beginner or expert — reads this same picture to understand what’s happening in the market.